
What you can do with COMCOM Analytics
See how your Discord community moves, from 8 angles. Here we walk through the real dashboard, one screen at a time.
Summary
Your server at a glance — member changes, activity levels, and who is driving the conversation, all on one screen.
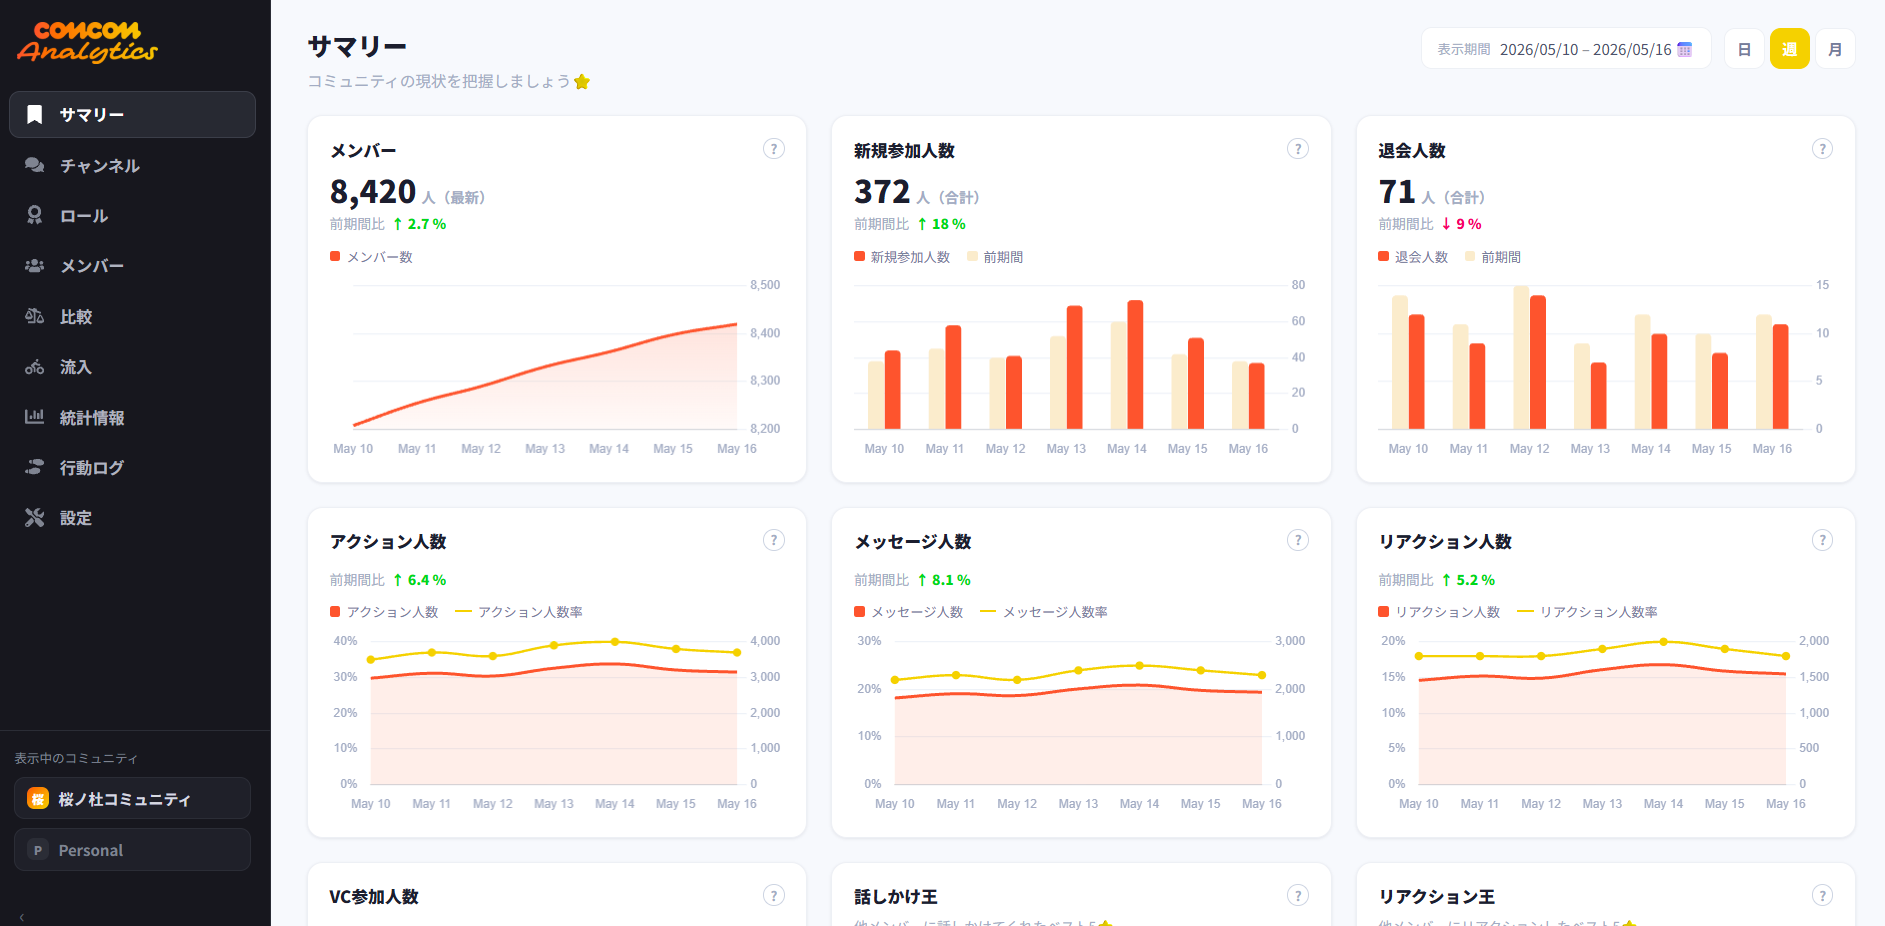
Community summary
- Members, new joins, and leaves, each with change vs. the previous period
- A growth trend line that shows whether you are climbing or slowing down
- Daily trends for active members, messages, and reactions, side by side
Click the image to view it full size.
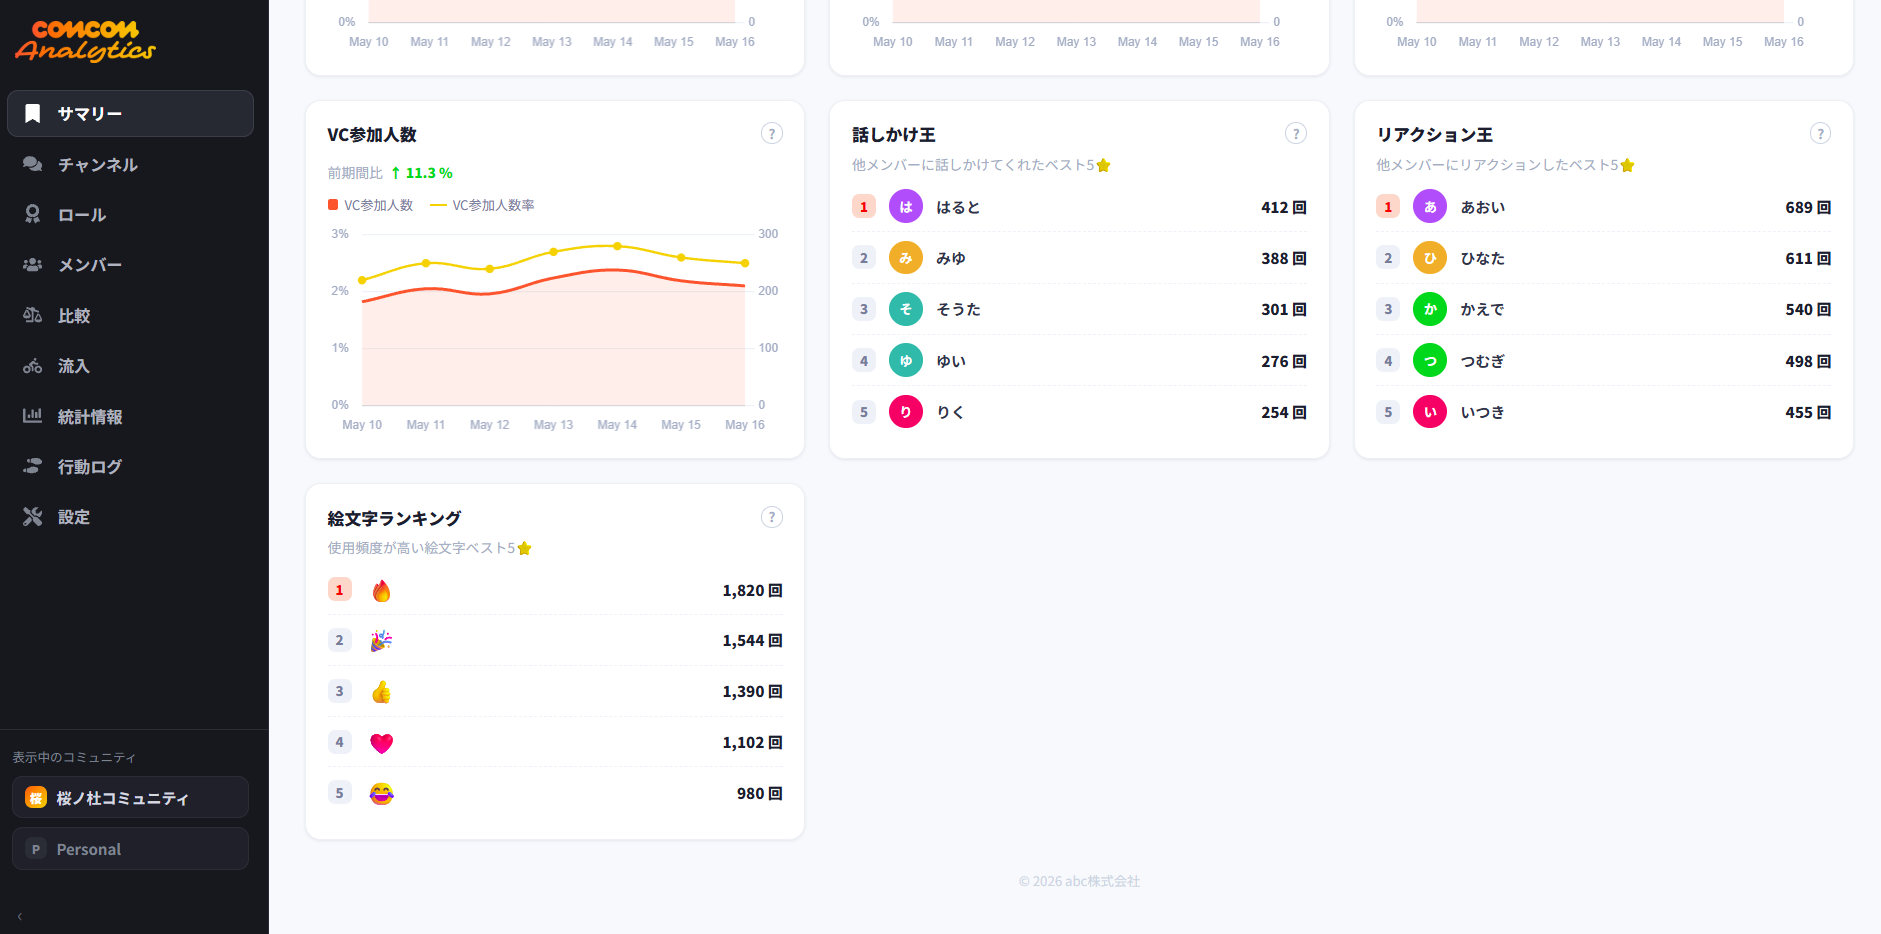
Top contributors
- Voice-channel participation trend
- Top talkers (most messages) and top reactors (most reactions)
- A ranking of your most-used emojis
Click the image to view it full size.
Channels
Which channels are growing and which have gone quiet — broken out by text and voice.
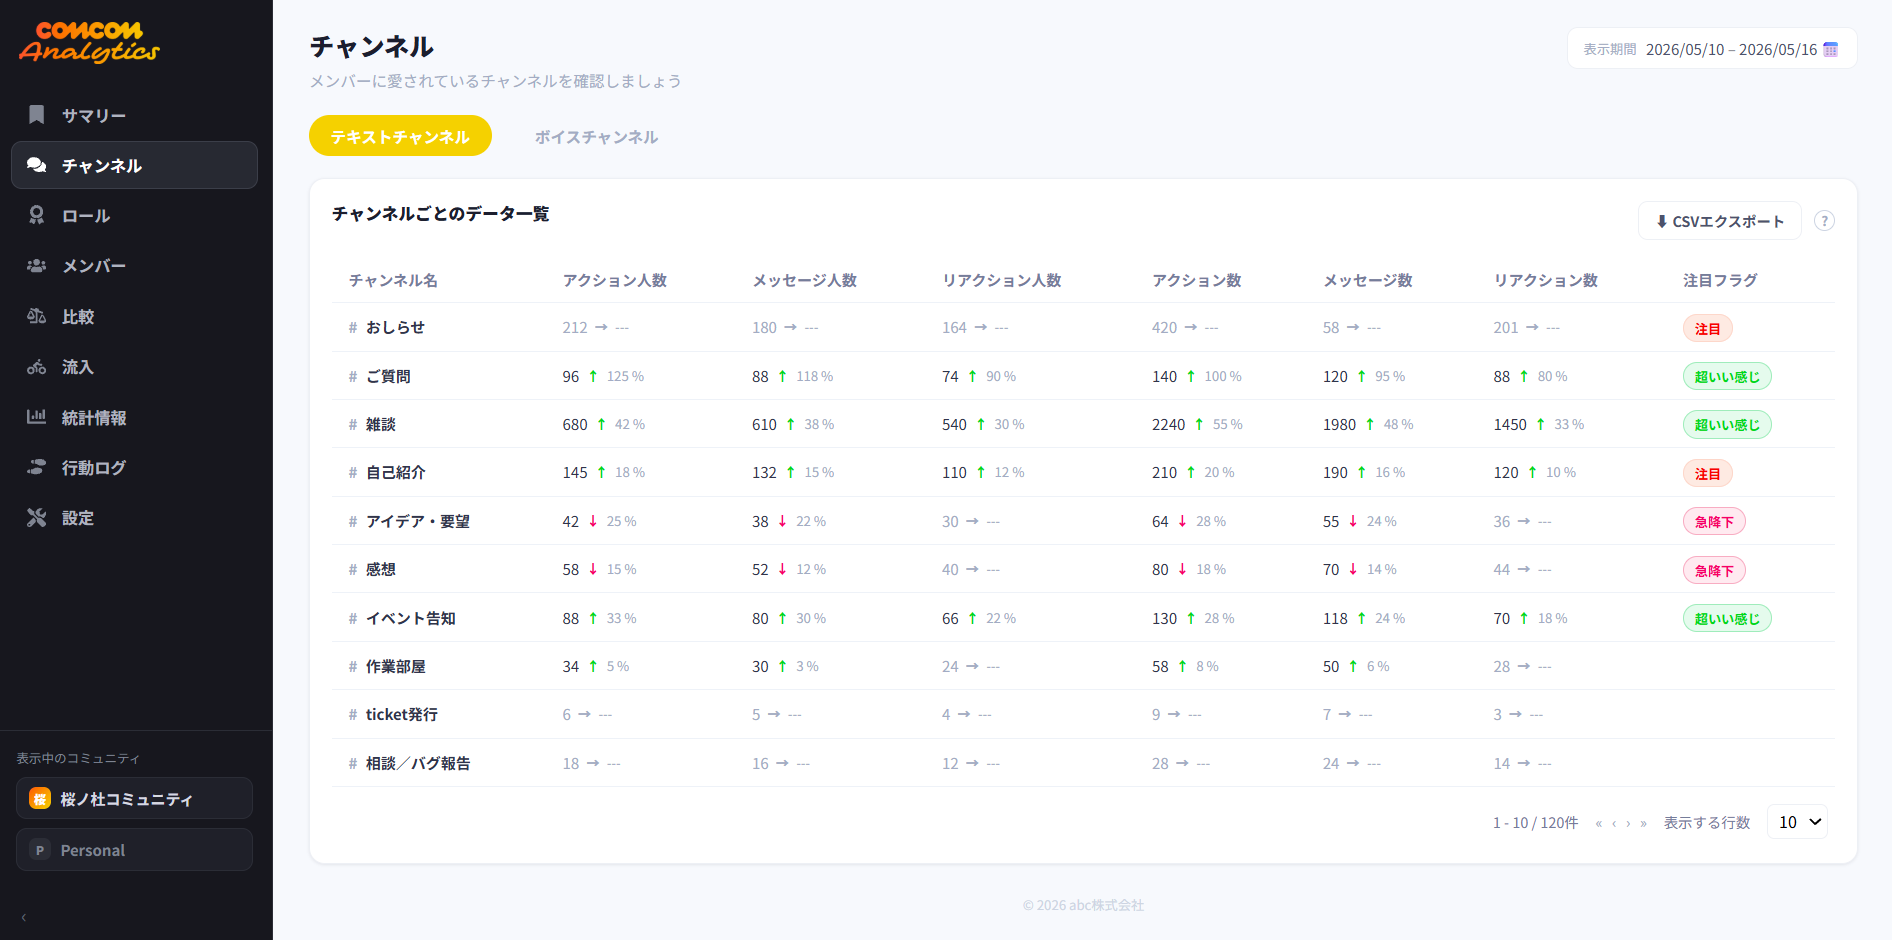
Text channel analytics
- Messages, reactions, and participants per channel
- Change rate vs. the previous period, with automatic flags like "rising", "on fire", and "falling"
- CSV export supported
Click the image to view it full size.
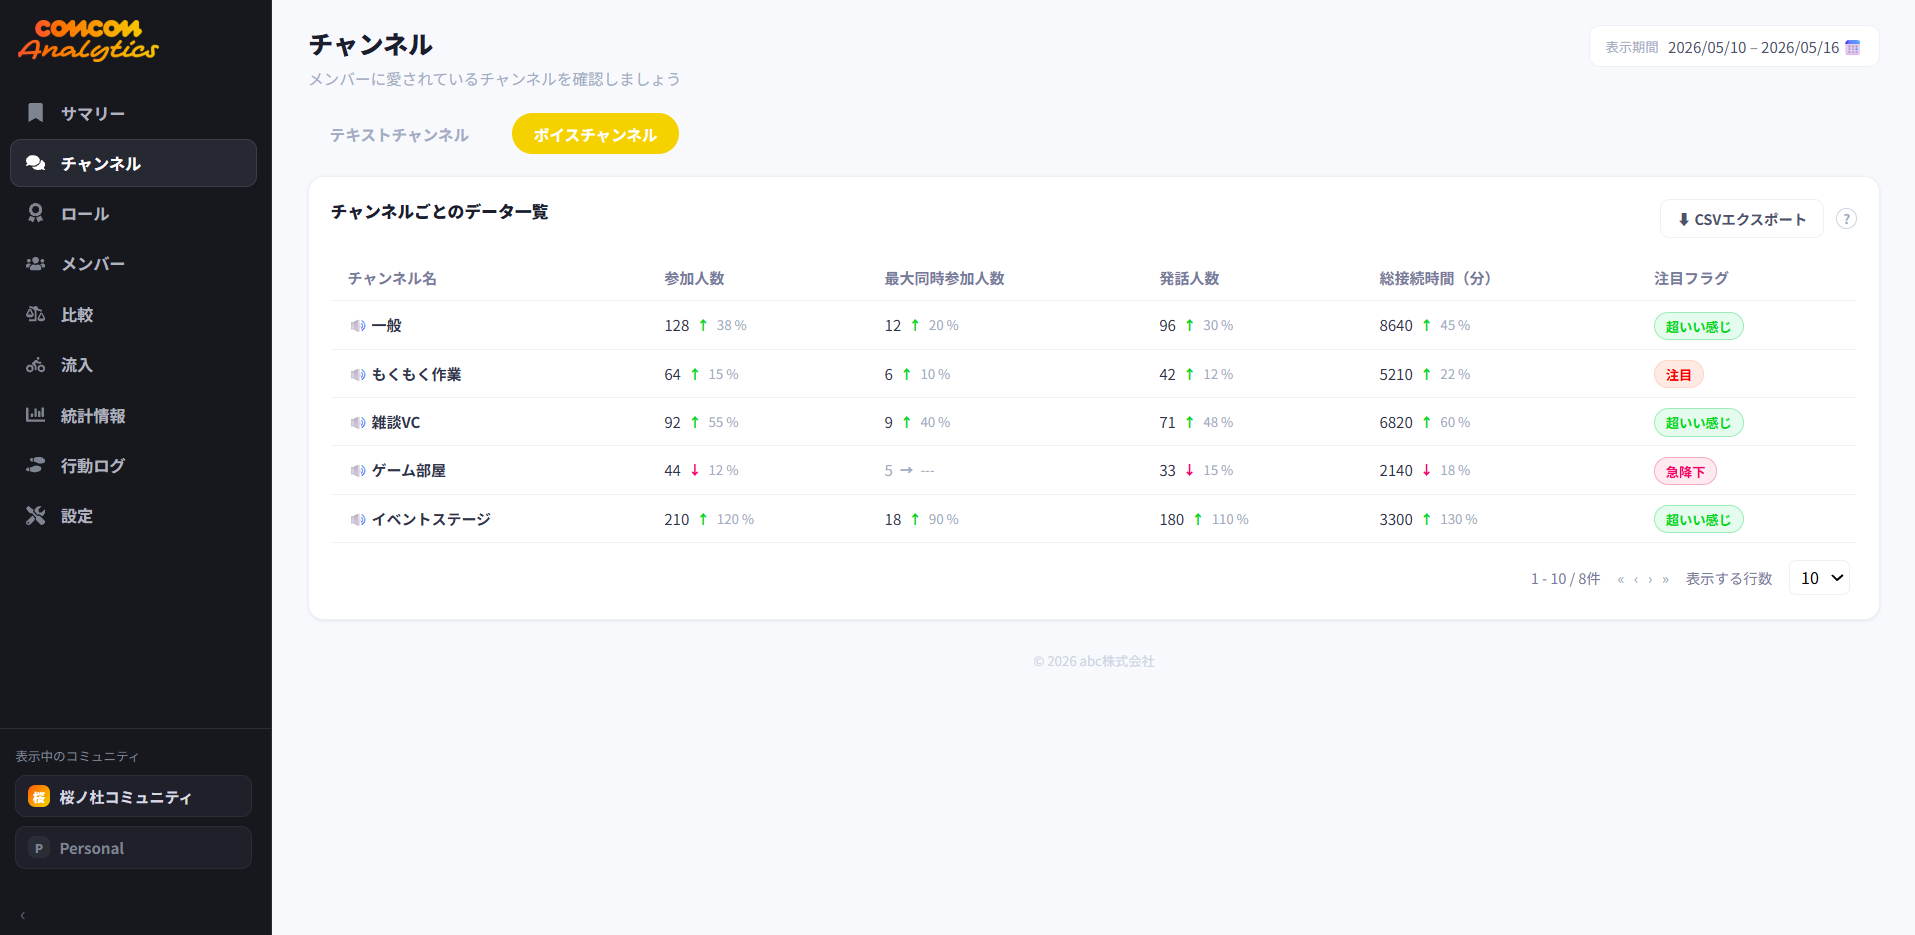
Voice channel analytics
- Participants, peak concurrency, speakers, and total connected minutes per channel
- See at a glance which VCs are lively and which are empty
Click the image to view it full size.
Roles
Activity by role — see which segment of members is actually driving the community.
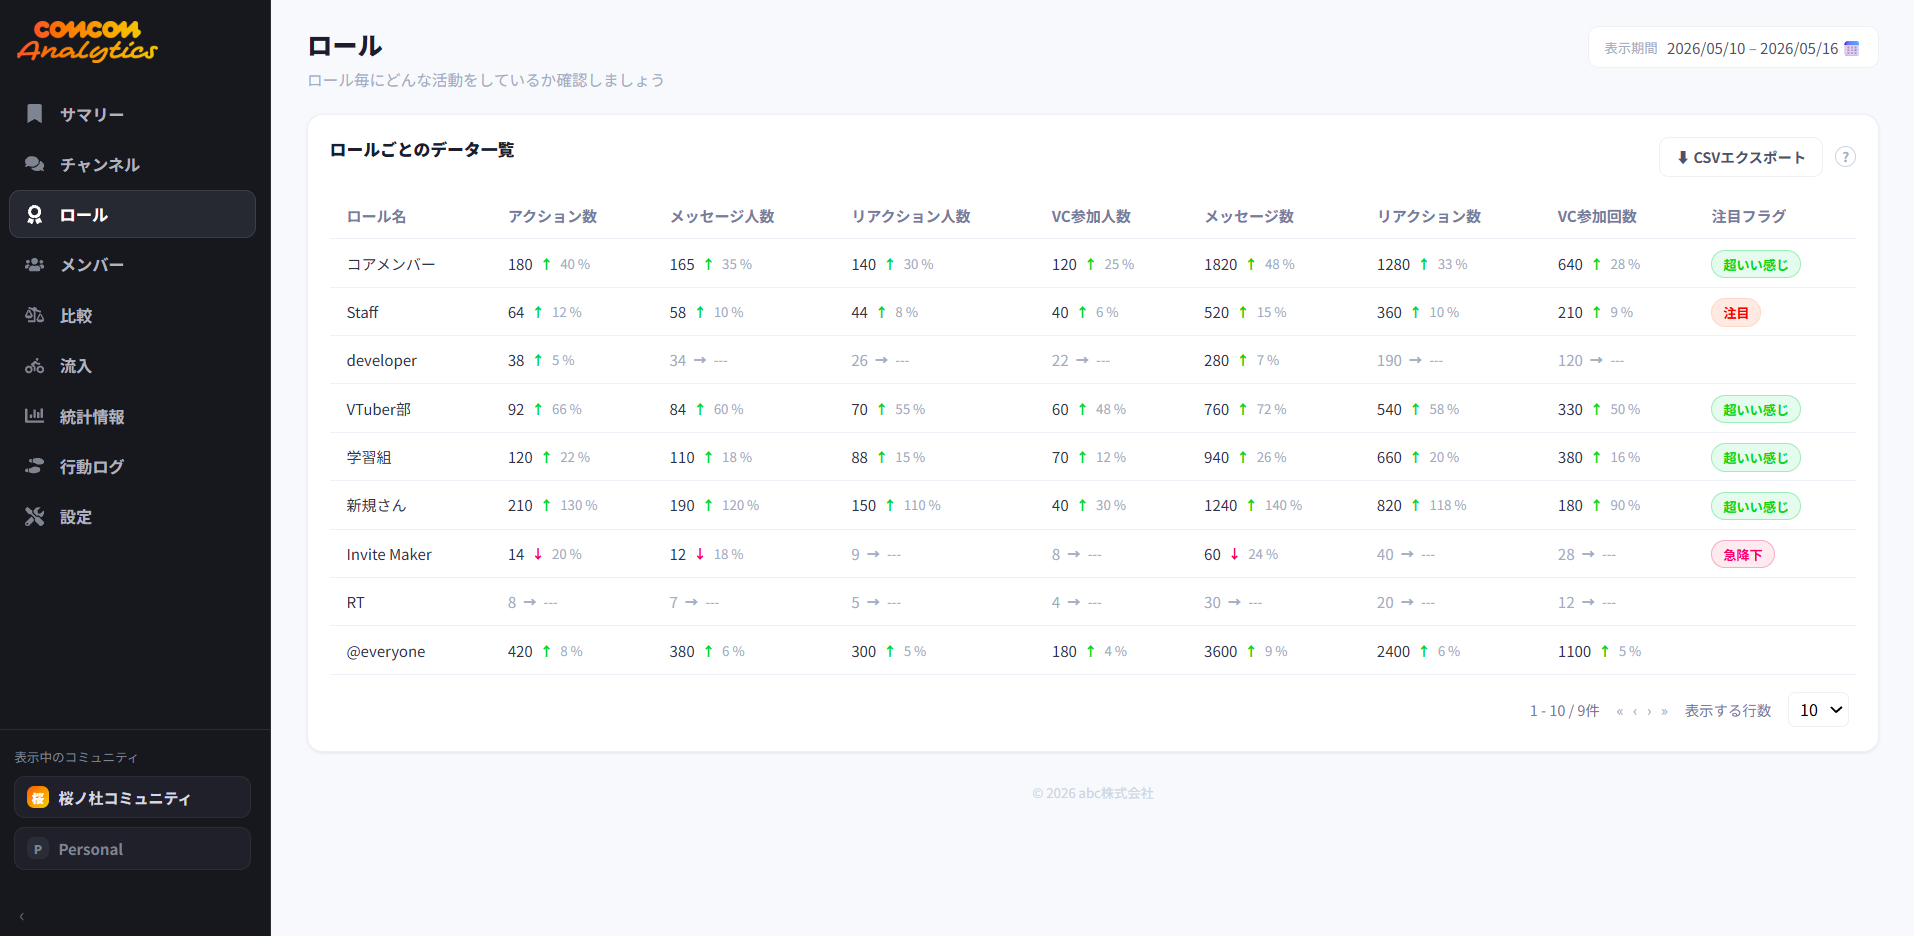
Activity by role
- Actions, messages, reactions, and VC participation aggregated per role
- Surface how core members, staff, or any specific role are engaging
Click the image to view it full size.
Members
Every member's activity — as a sortable list, or as an individual profile.
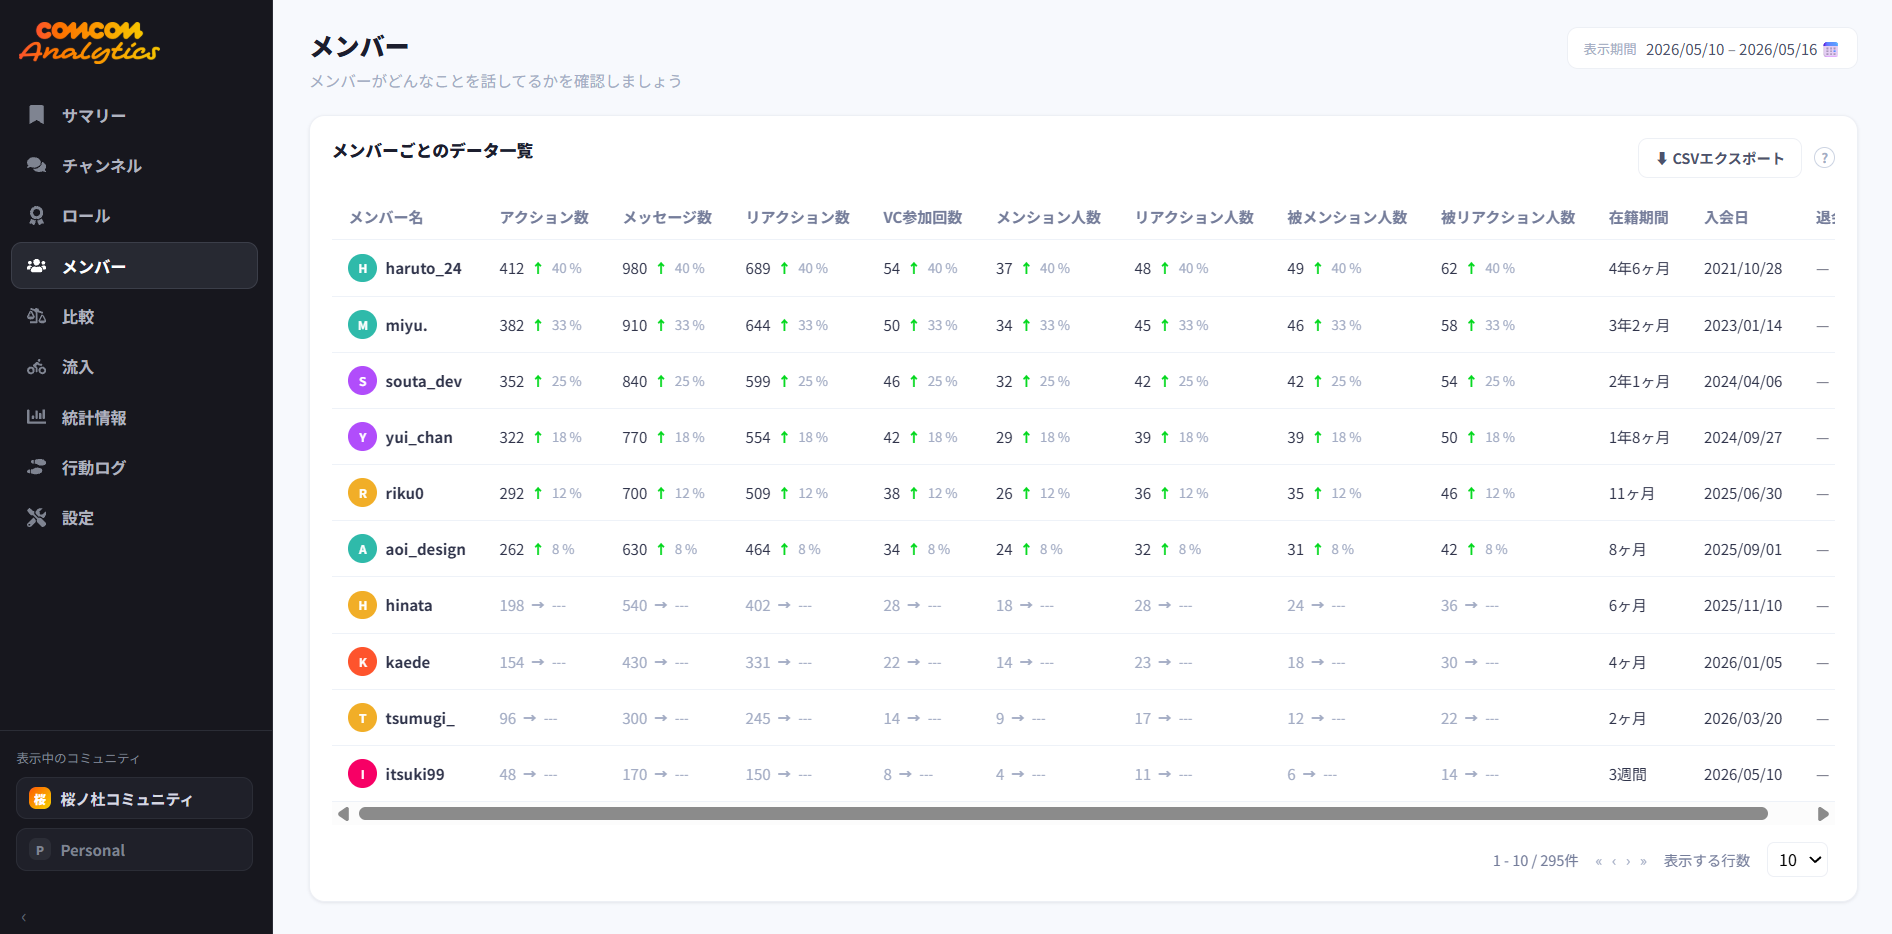
Member list
- Actions, messages, reactions, VC, mentions, tenure, and join date for every member
- Sorting, search, and CSV export supported
Click the image to view it full size.
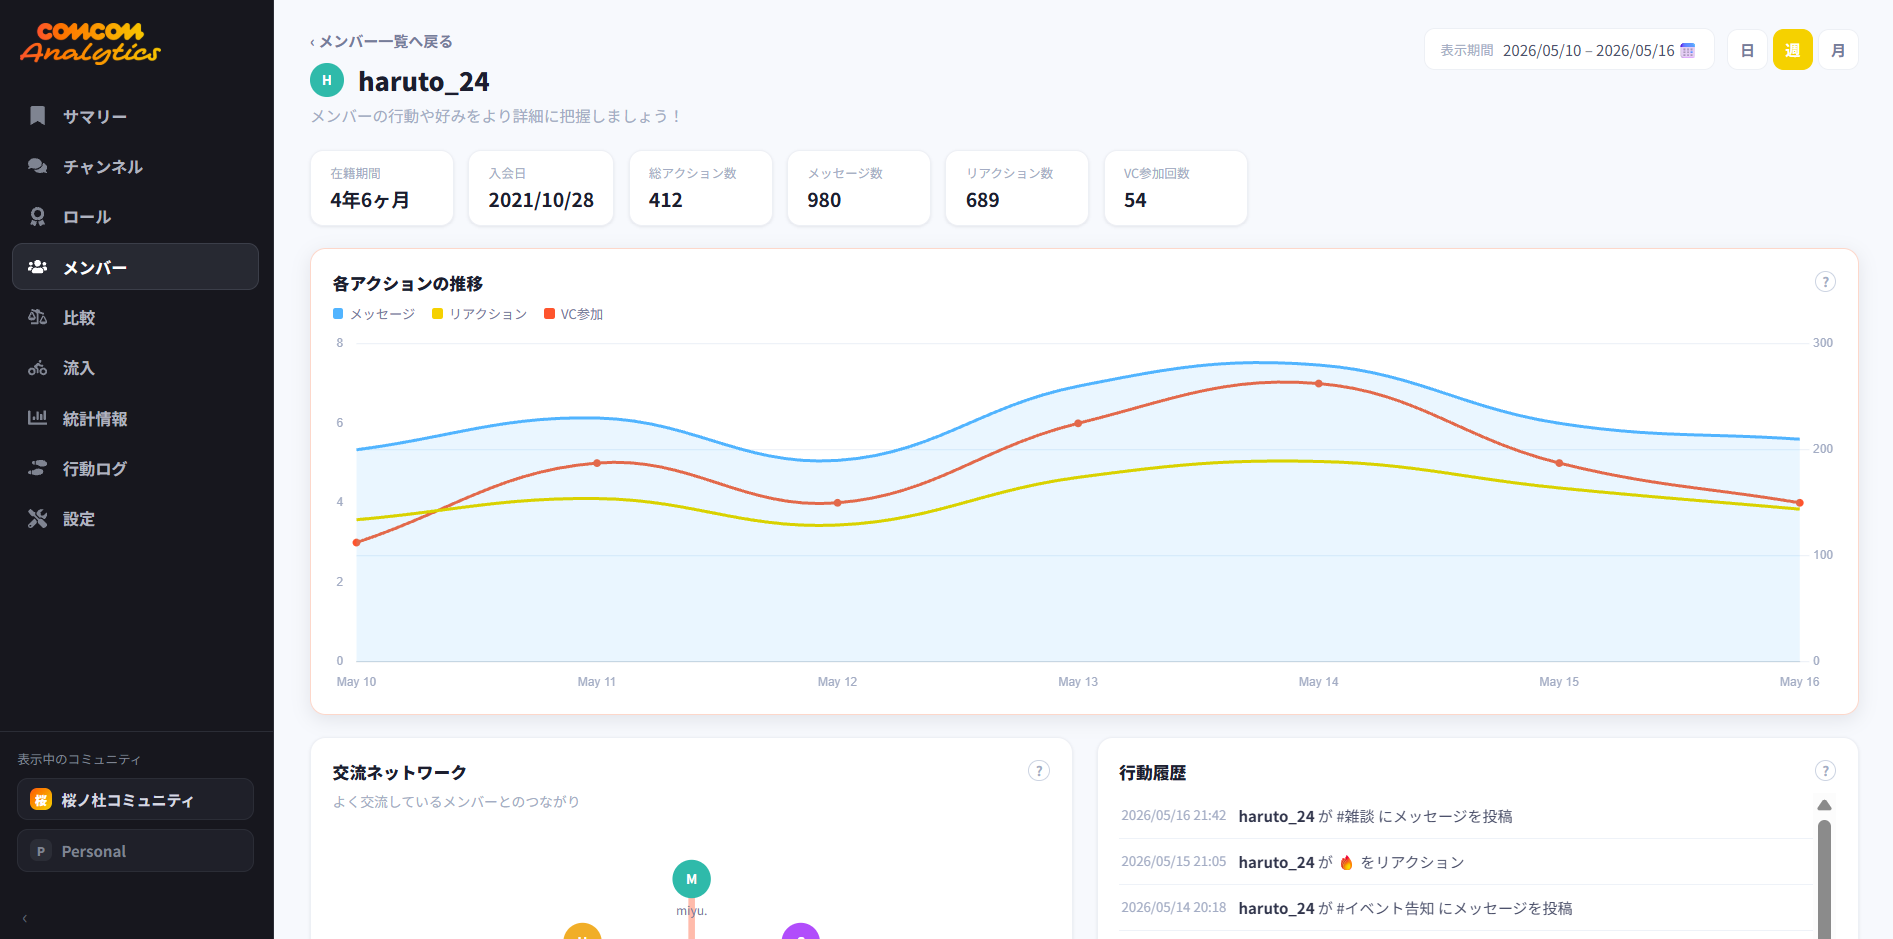
Member detail — profile
- Summary cards for tenure, join date, and lifetime actions
- A line chart of each action type over time
Click the image to view it full size.
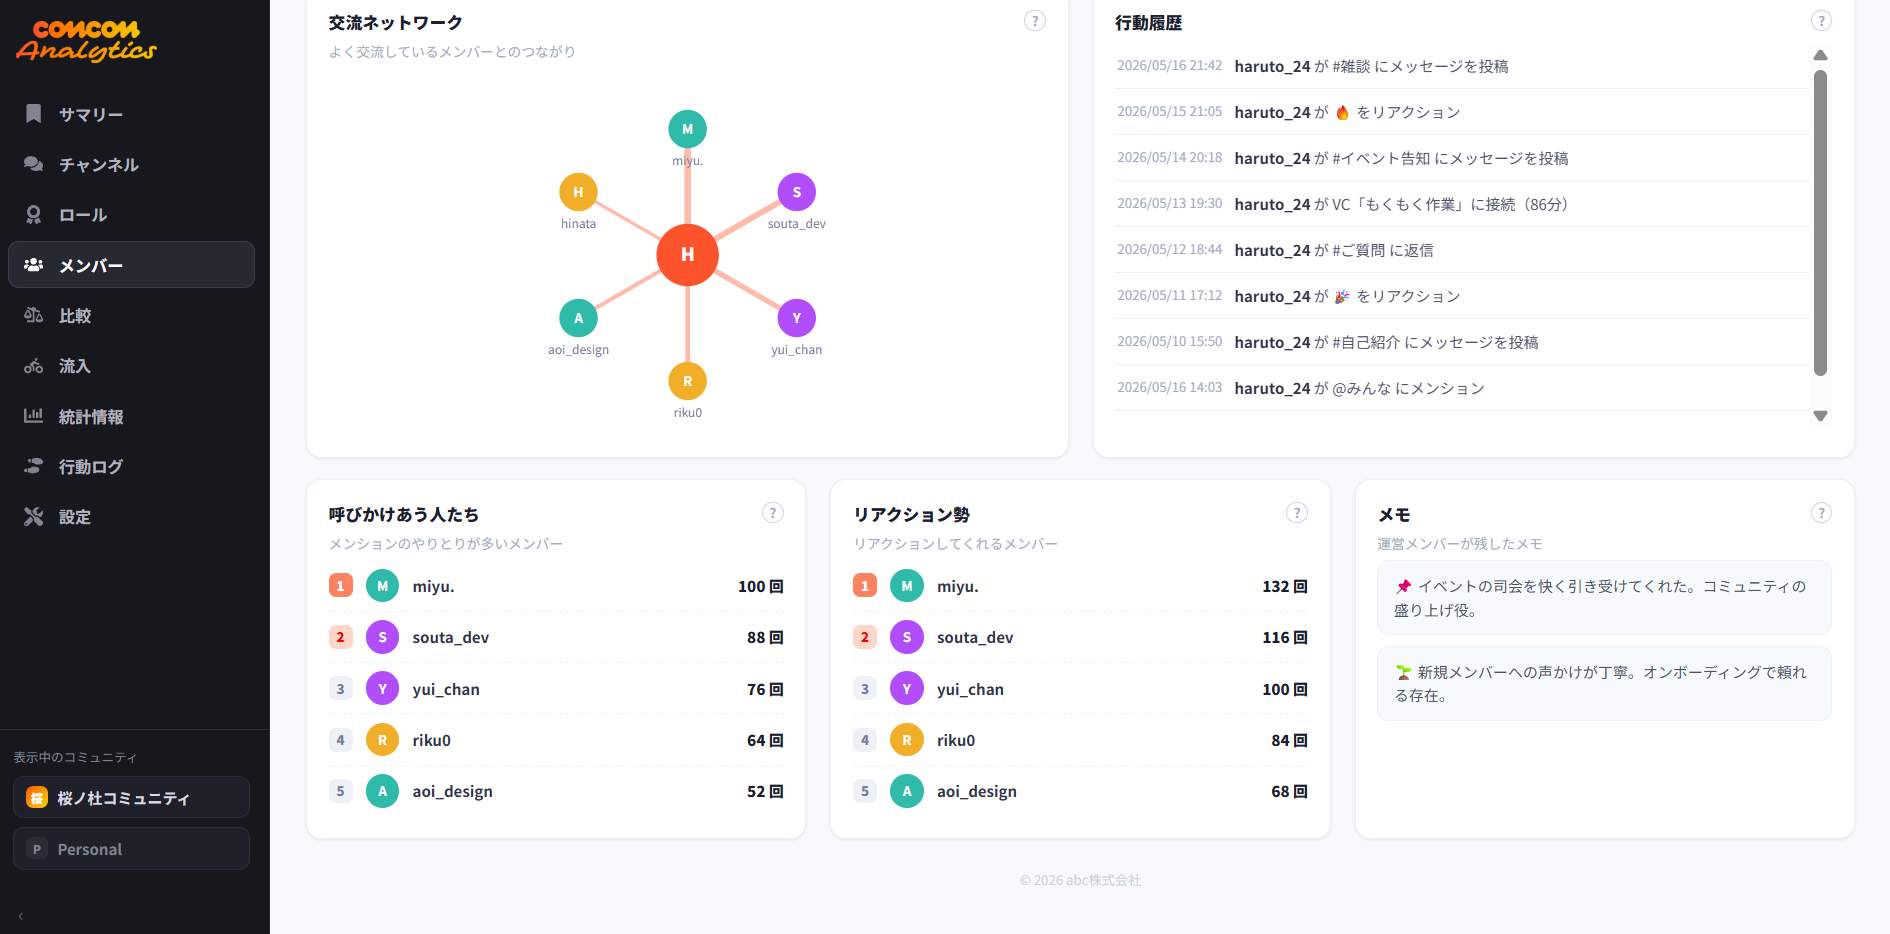
Member detail — relationships
- An interaction-network graph showing who they engage with most
- An activity timeline, plus who they mention and react to
- An operator notes field for your own observations
Click the image to view it full size.
Comparison
See objectively where your server stands among communities of a similar size.
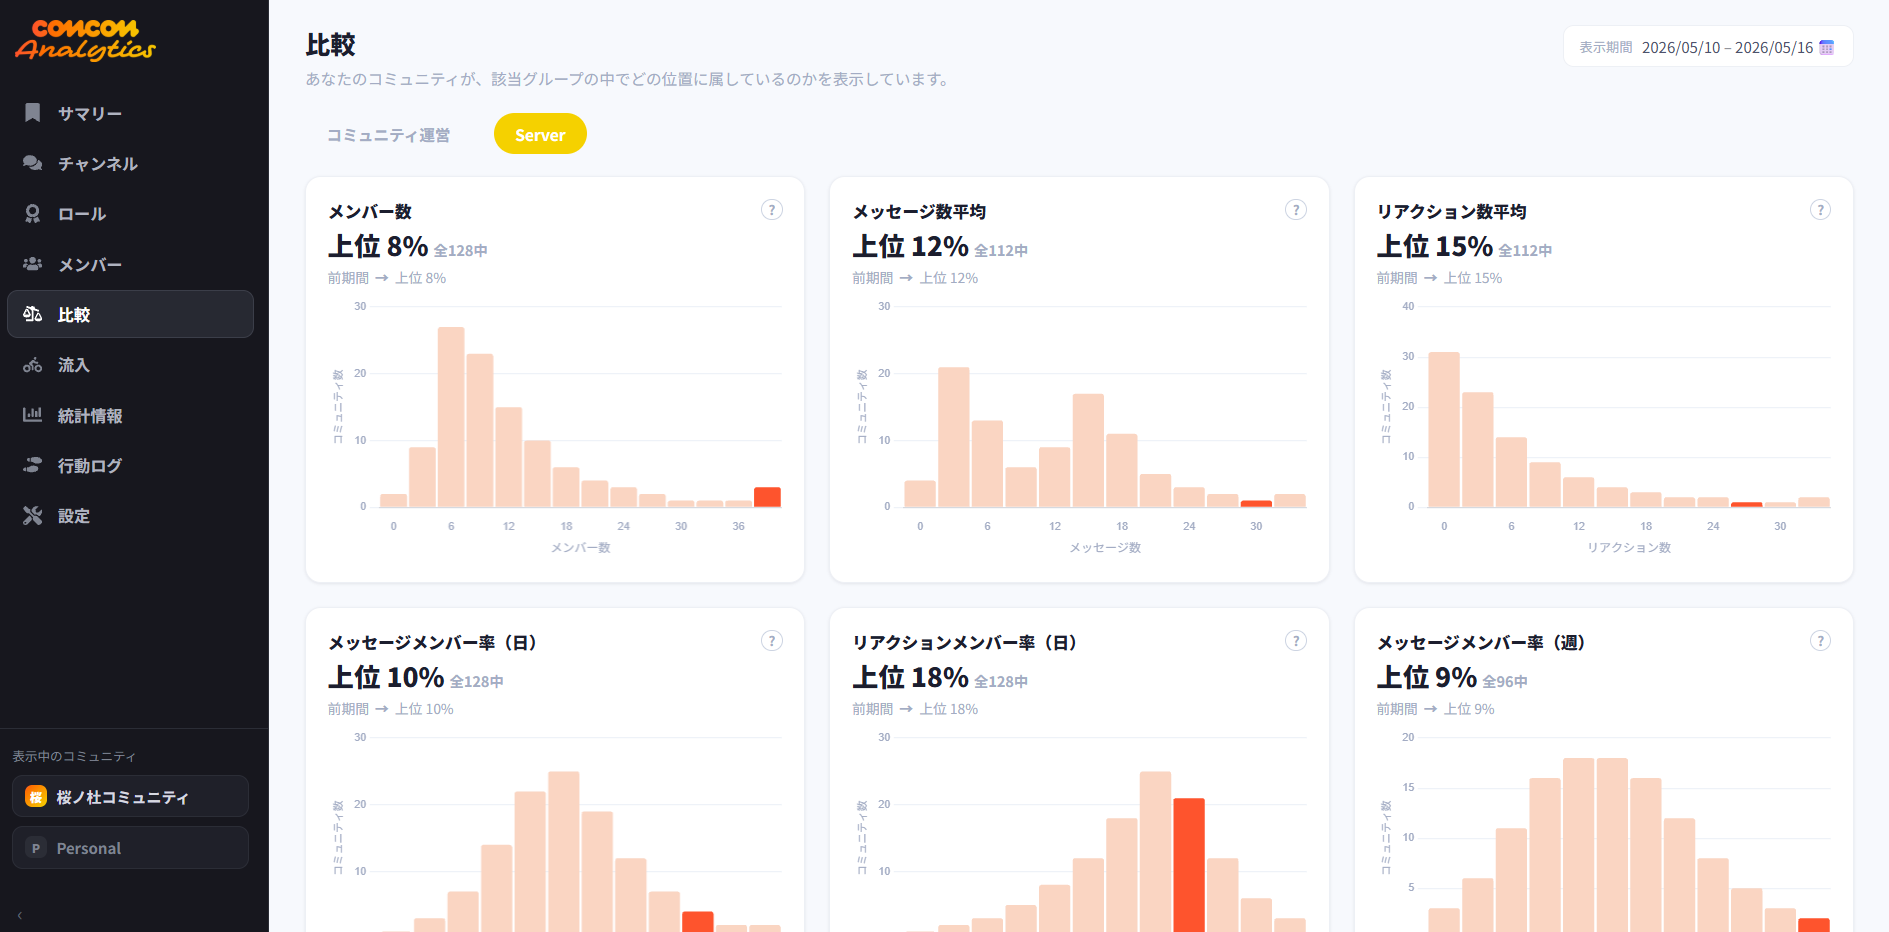
Where you stand
- A "top X%" figure for members, average messages, average reactions, and more
- Your position visualized within the distribution (histogram) of all communities
Click the image to view it full size.
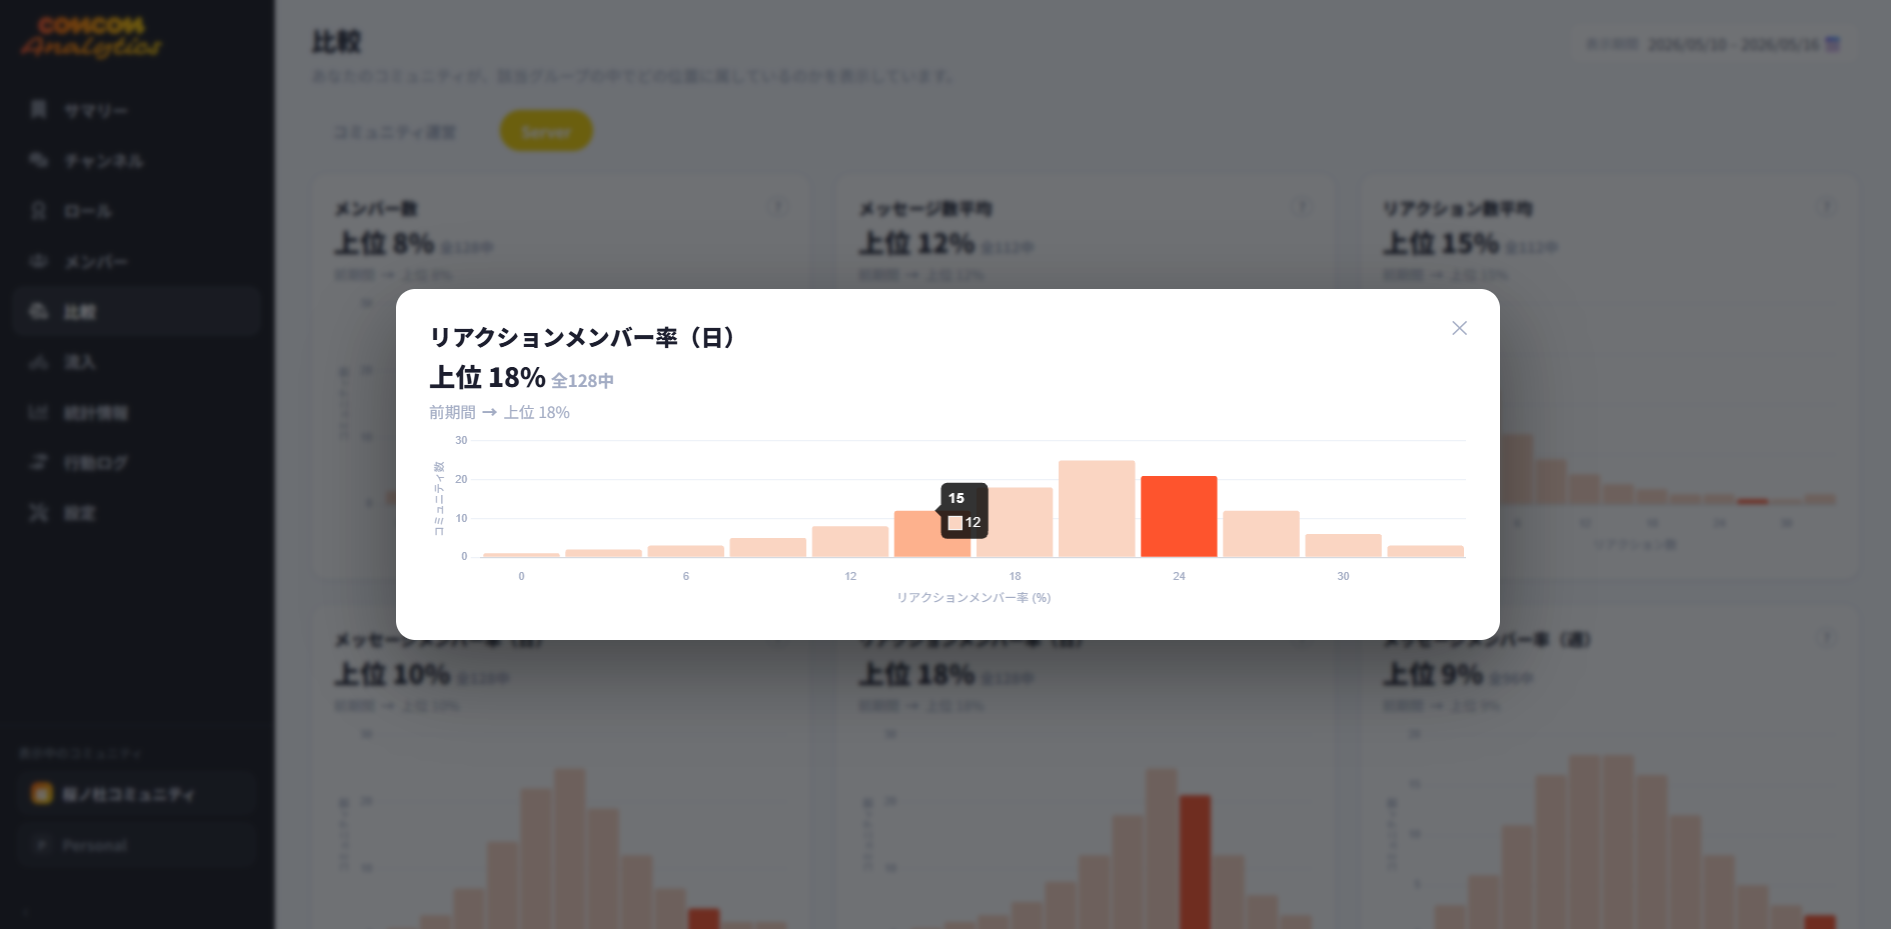
Distribution detail
- Expand any metric's histogram to inspect the distribution and your exact position
Click the image to view it full size.
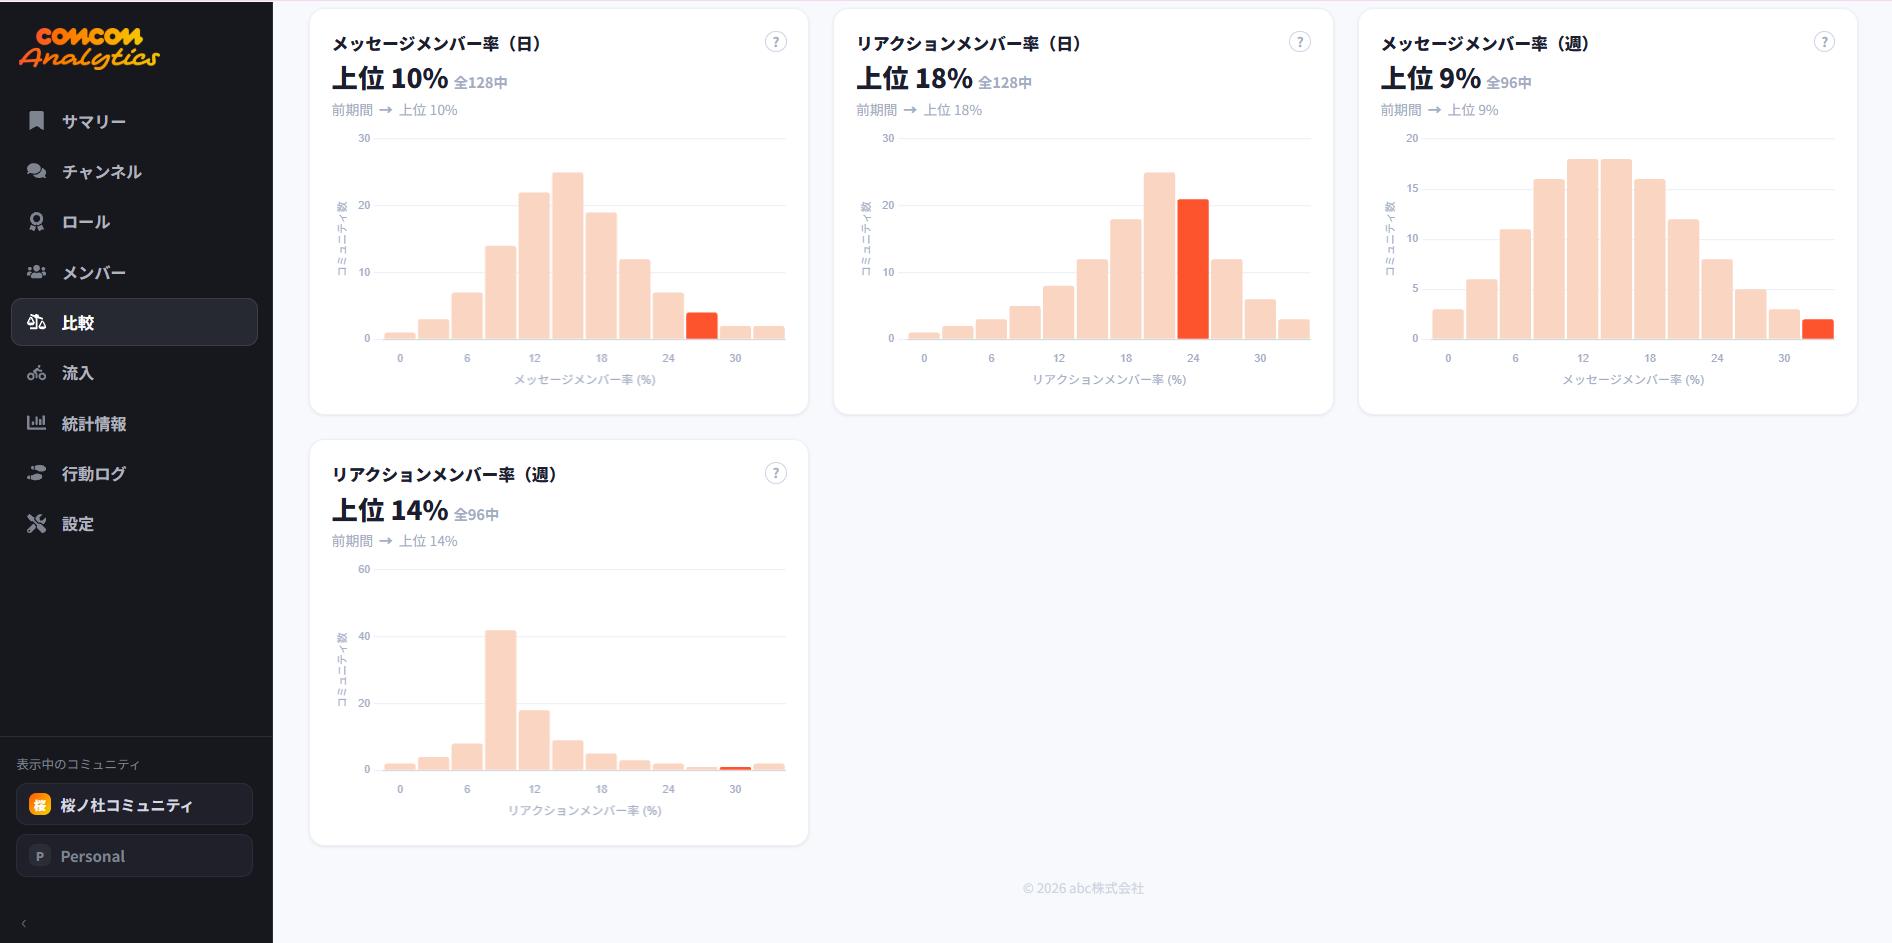
Engagement-rate comparison
- Rankings for messaging and reaction member rates (daily and weekly)
- Judge objectively whether you are active for your size
Click the image to view it full size.
Acquisition
Where new people come from and how many are arriving — traceable down to each invite link.
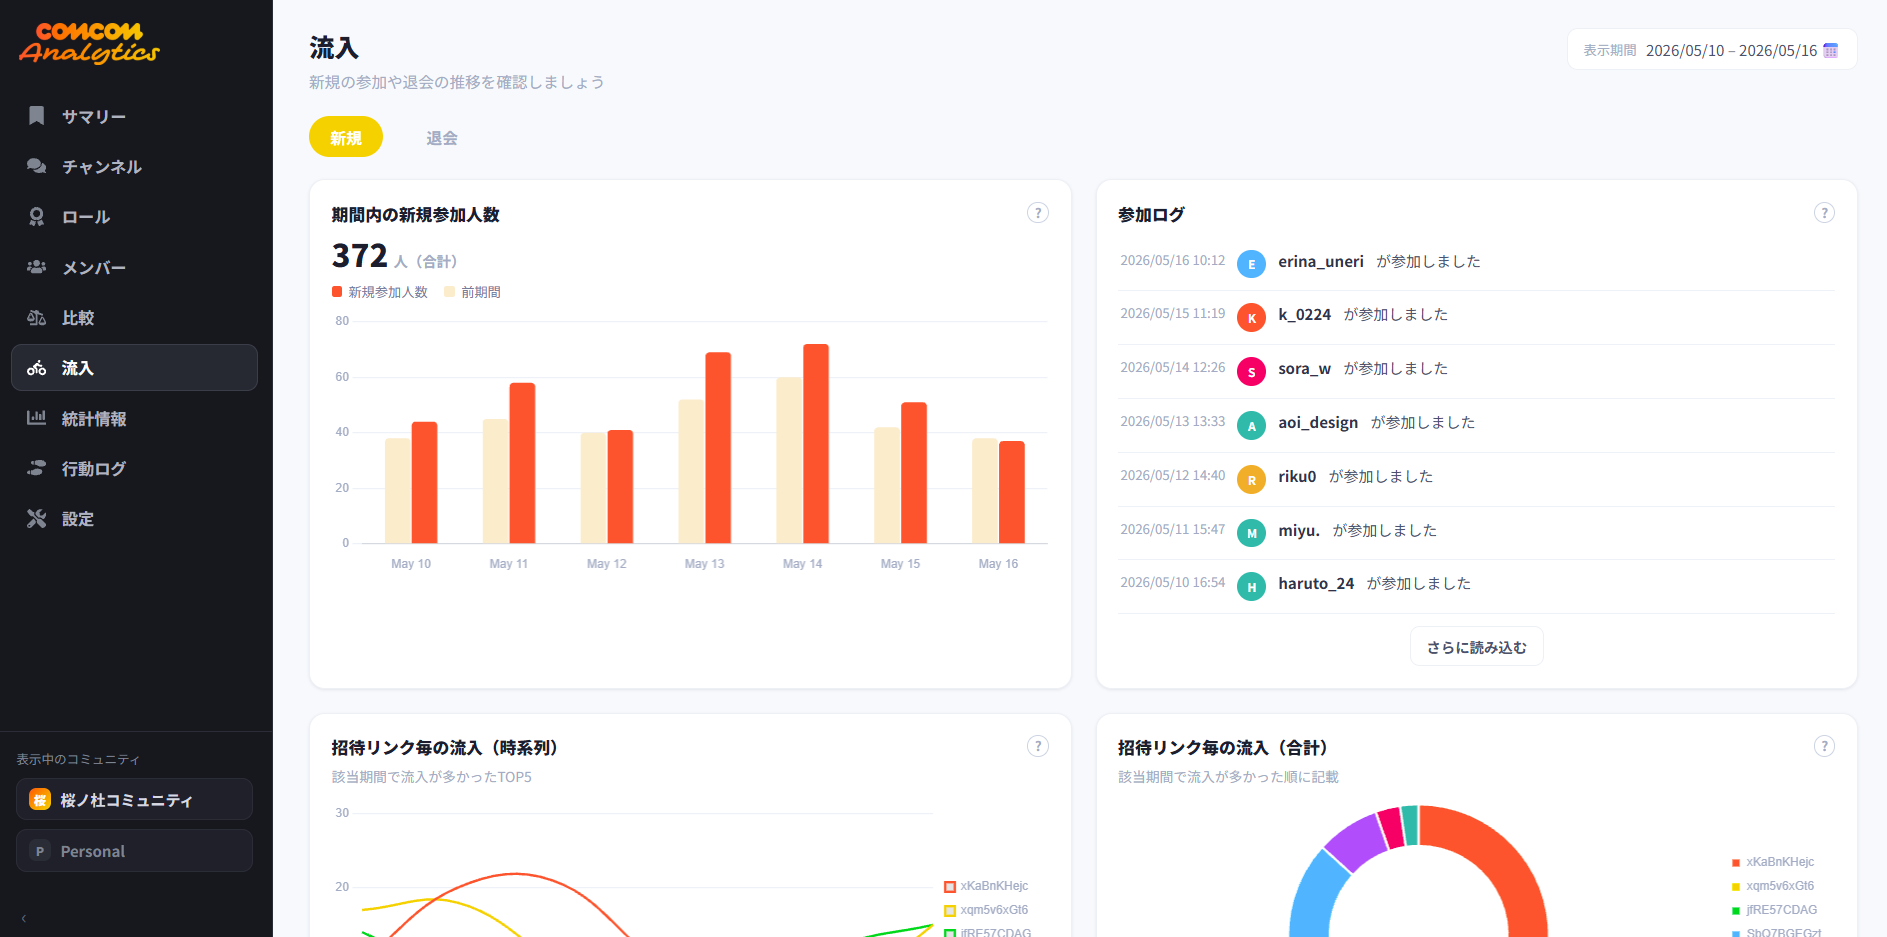
New joins and leaves
- New joins for the period, compared against the previous period
- A join log showing who arrived and when
- Acquisition per invite link, shown as a time series and a donut
Click the image to view it full size.
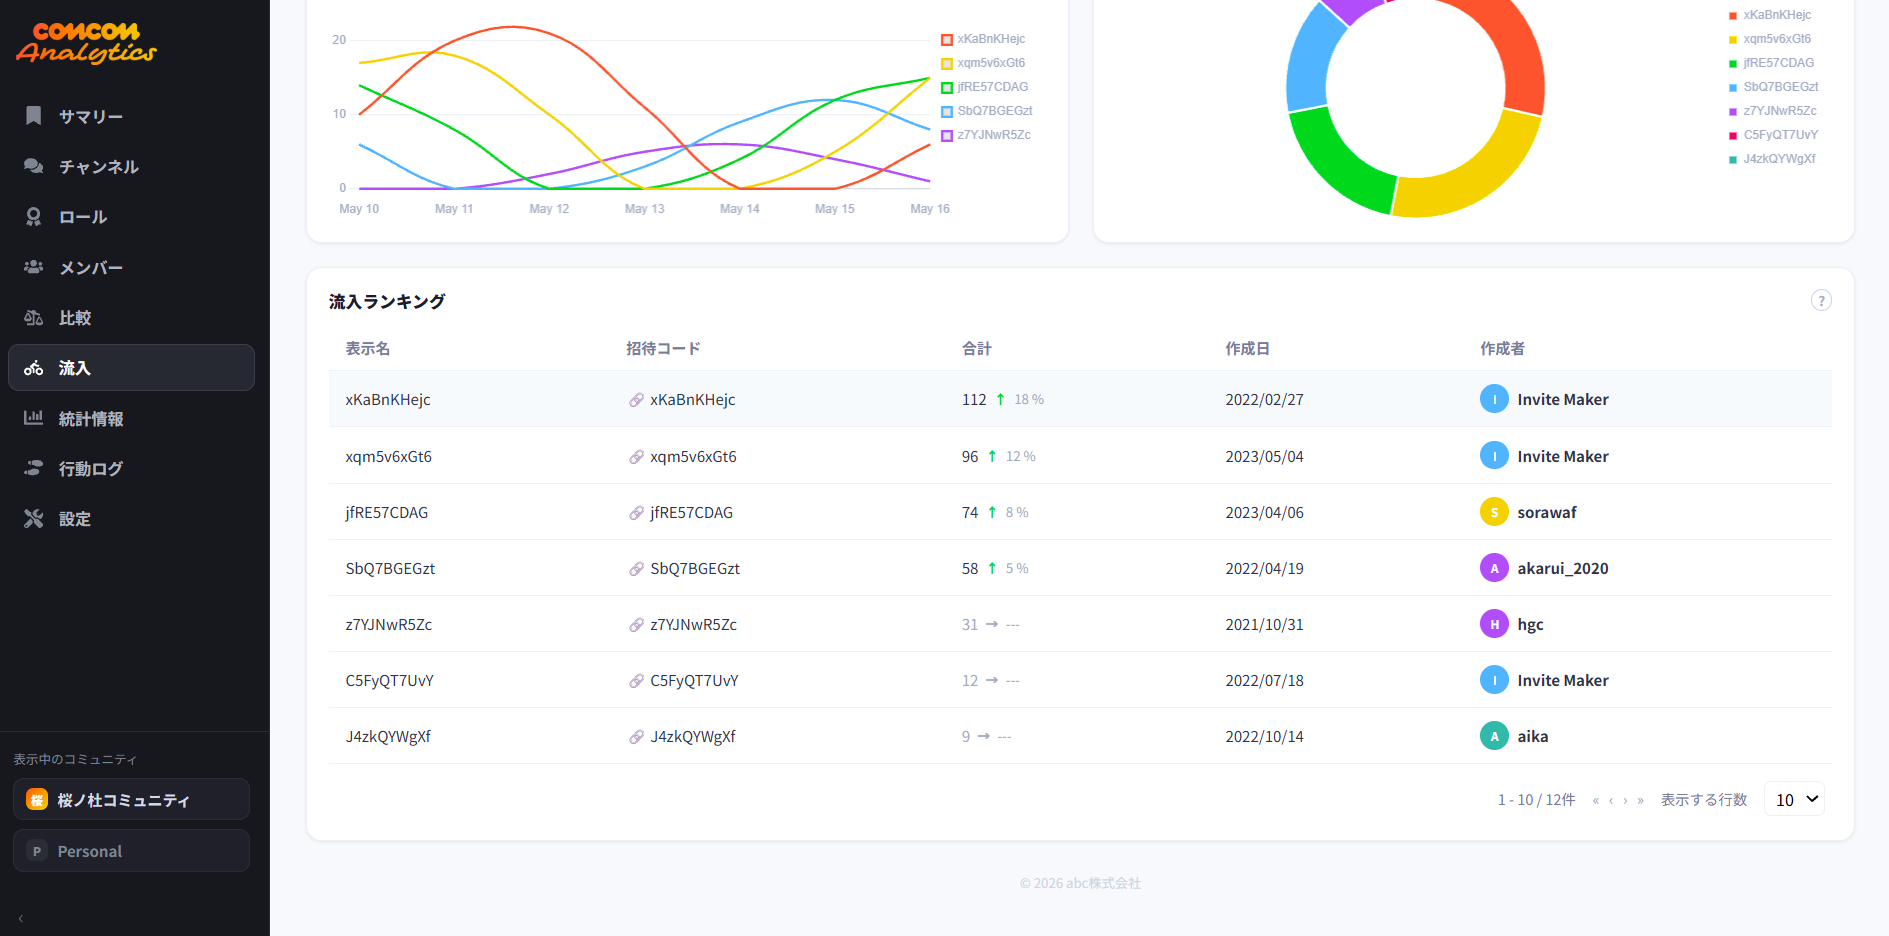
Invite-link ranking
- Rank which invite links — and whose invites — are working
- Down to the invite code, total, change rate, created date, and creator
Click the image to view it full size.
Statistics
The big picture of your community, in numbers and charts.
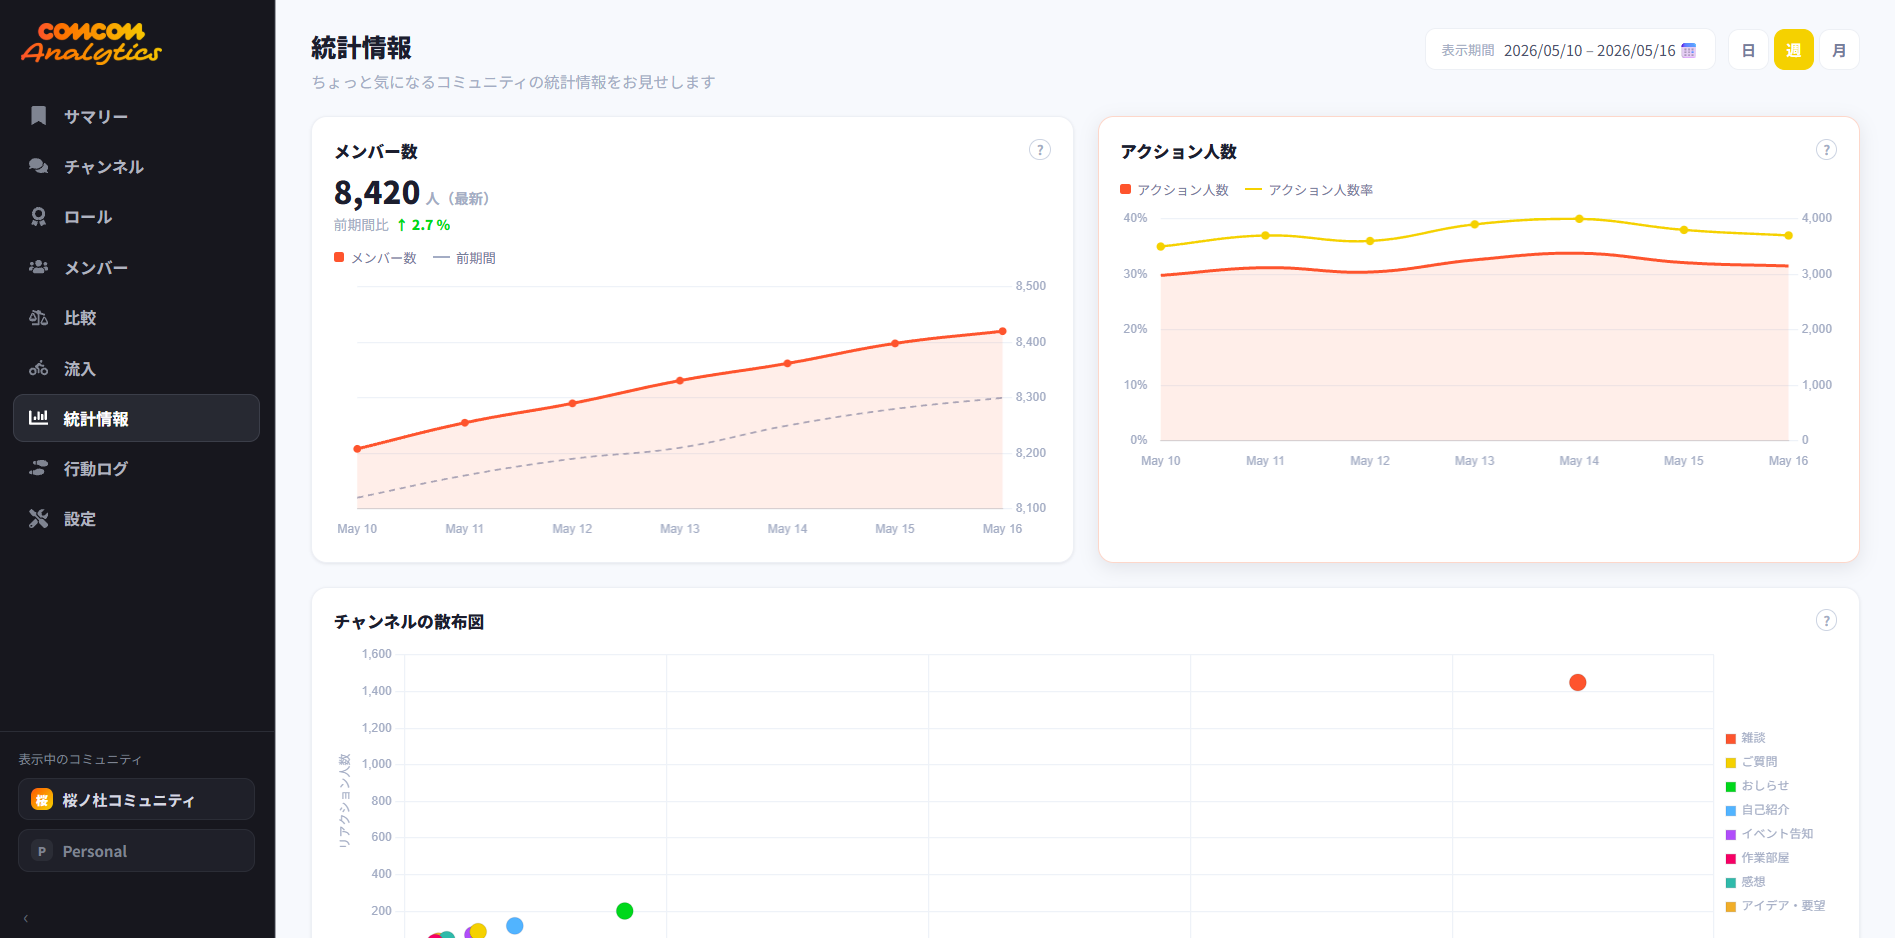
Overall trends
- Member-count trend with change vs. the previous period
- Active-member count and active-member rate over time
Click the image to view it full size.
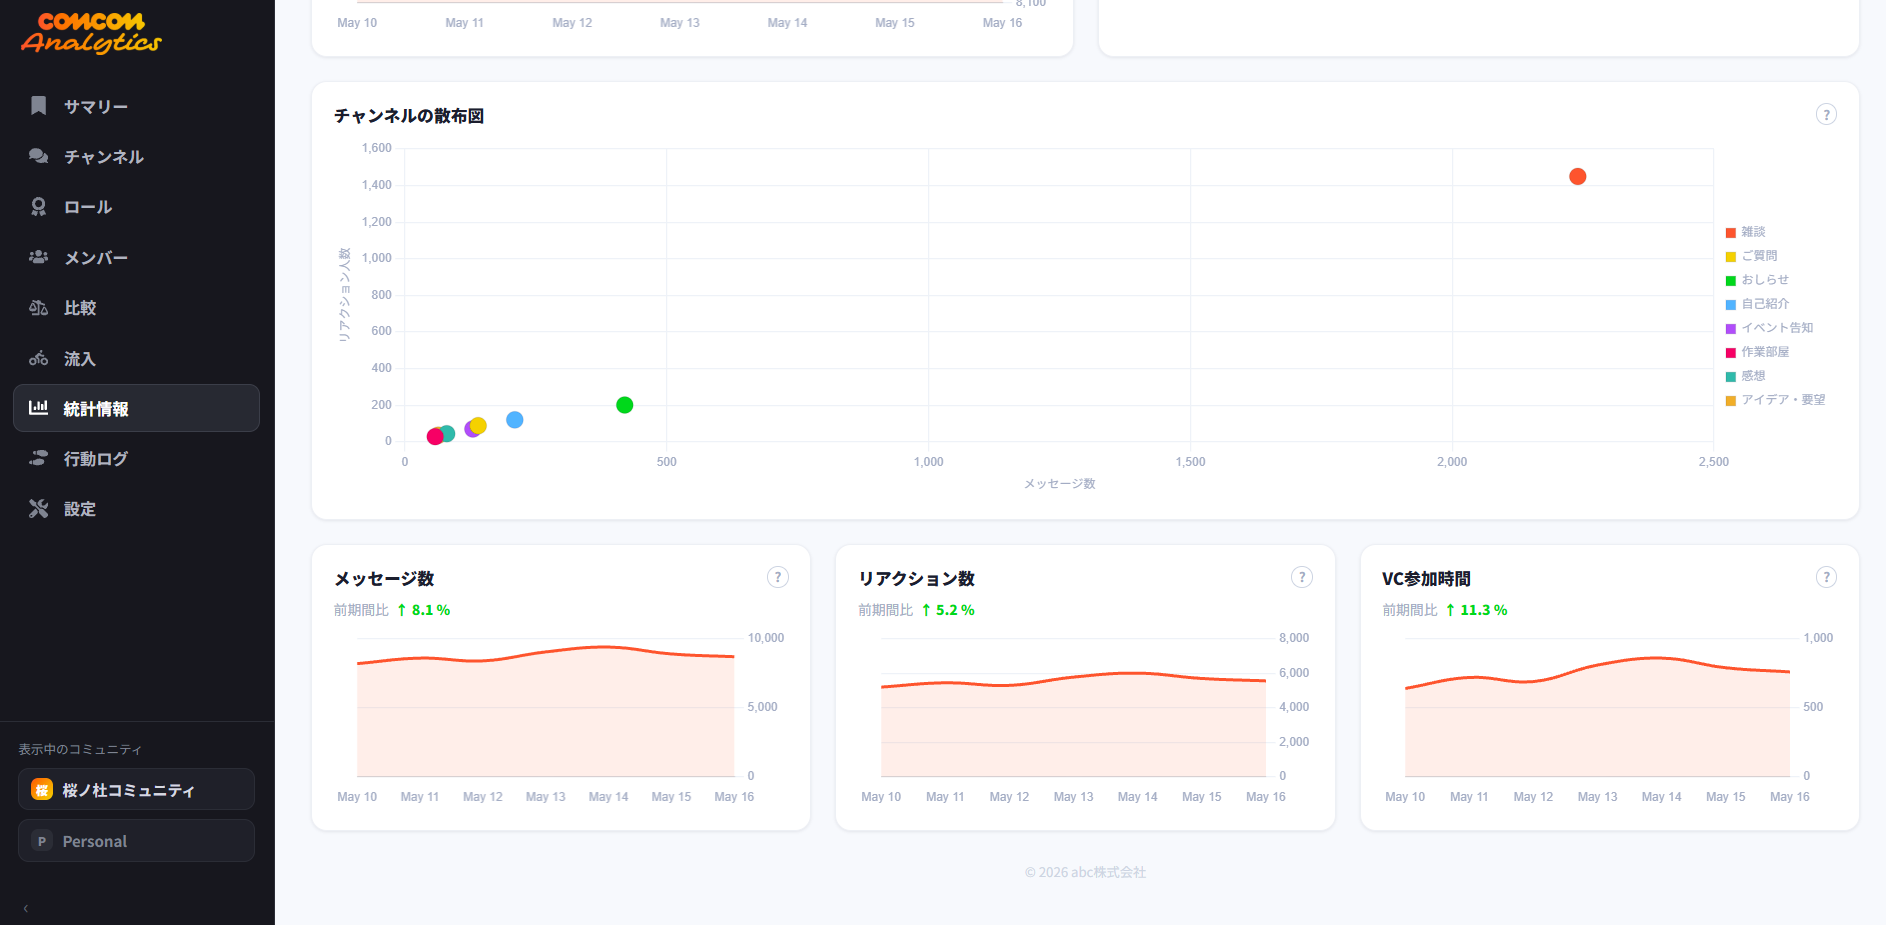
Channel scatter plot & key metrics
- Plot channels by messages × reactions to understand their character
- Track changes in messages, reactions, and VC time
Click the image to view it full size.
Activity log
Look back on individual actions and search them by keyword.
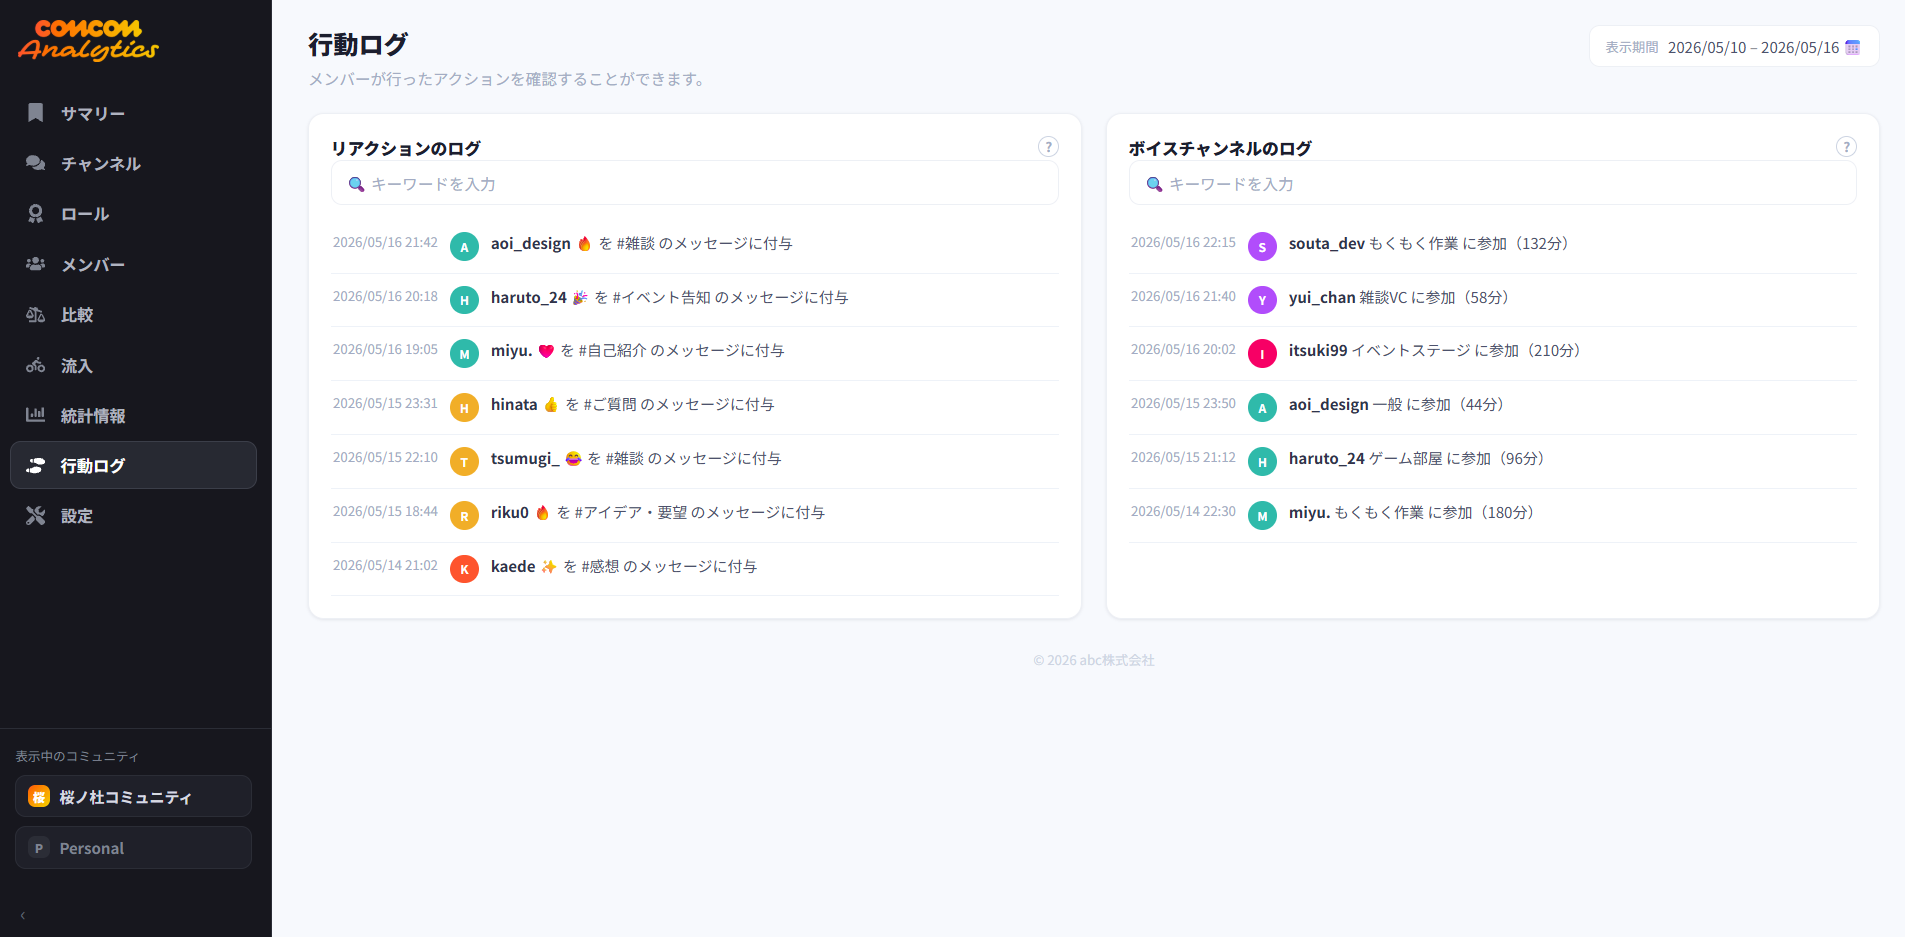
Reaction & VC logs
- A reaction log (who added what, to which message)
- A voice-channel log (who joined which VC, when, and for how long)
- Keyword search supported
Click the image to view it full size.
Want to try it on your own server?
COMCOM Analytics is free to install. Every screen shown here works right away with your community's own data.